Mood Tracker
Sensing and Internet of Things coursework project where the aim was to learn about:
Data visualisation, data collection, data analysis and sensing and sampling methods.
I was interested in discovering if there was a correlation between my sleep, my step count and my mood.
Demo of trained weights
Demo for the entire system
To find a correlation between my sleep, steps and mood, I wore a Fitbit and collected my data through a third party API. I then had to assign labels for my sleep and steps data in terms of mood, so I took a photo of myself every hour for a week!
Meanwhile I trained the image recognition algorithm YOLOv3 and v4 on the AffectNet dataset, which contains ~1M images of labelled facial expressions.
Data collection

Fitbit Ionic. Credits: PopularMechanics

YOLOv3 Training on AffectNet database with 53000 images

YOLOv4 Training on AffectNet database with 53000 images
(first part of the plot is missing due to a power cut)
During training I experimented with different parameters in the .cfg file to find a compromise between image resolution, batch size and speed of training, making sure to run the training process at the highest RAM capacity of my GPU without throwing the error of memory exceeded. I reduced the resolution and increased the batch size which did not cause any significant downgrade to the training because the images in the dataset were cropped to fit the face.
After training, I then assessed the mean average precision (mAP) and total average loss in the chart and selected the best performing set of weights from the first values that converged, to avoid overfitting. The total time to train was about 4 days, and due to the duration of the training, the mAP charts are discontinuous, because I experienced power cuts throughout the training.


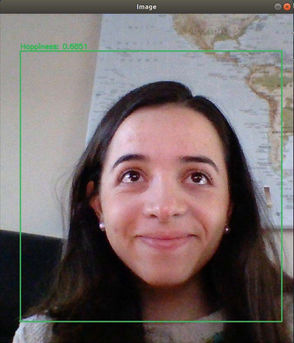
Happiness 85%
Surprise 51%
Once I had the final weights, the aim was to build the main dataframe with my sleep, steps and mood data. For the sleep and steps I had appended the data into a csv file with the 3rd party API and a parser I wrote, and for the mood information, using another parser I wrote I scanned through all the images I had and collected the image metadata, ran them through the weights to get the confidence and the predictions and appened all this information to the main dataframe.

System overview
USER INTERFACE
Data collection was completed and the next part of the process was the user interface.
The data was analysed using pandas profiling and a html report was generated that was rendered through a Flask client-server app.
The user can visualize the information of all the data collected and toggle different datasets.
Further to this, the user can take a photo of themselves real time and send it to the server, where the photo will be run through the weights and the prediciton and confidence will be returned real time to the client.

Examples of what the client receives from the server after they take a photo of theselves.

Mood distribution that the user can see in the app

Step count histogram diplayed in the app
Above are some brief examples of the data the user can see on the visualzation platform that is rendered by flask. Full report can be seen on the video demo here.
DATA ANALYSIS

PhiK correlation matrix
The visualization allows the user to toggle different variables and explore the interaction between any pair they wish to try.
It also provides different correlation matricies that shows the correlation between all of the variables.
Because the predictions data is categorical, the Phi K correlation coefficient was used. This coefficient is a new correlation coefficient between categorical, ordinal and interval variables with Pearson characteristics and works consistently between categorical, ordinal and interval variables.
From the matrix shown above it can be deduced that there may be a correlation between the predictions and the amount of REM sleep, but more data would be required to see if this correlation holds.

The image above takes a closer look at the mood and steps data. It shows the count of the times a mood appeared in that day as a percentage of the times it appeared in total.
It is worth noticing that the highest frequency of the happiness mood in the week appears between 12:00 at 15:00 in the day, which is also the time window when I walked the highest number of steps consistently throughout the week. This leads to believe there may be a positive correlation between step count and happiness frequency.


